

The market is up 25% this year. Your portfolio looks great. So why are seasoned investors quietly repositioning?
That’s the trap of a melt-up — a rapid, sentiment-driven price surge that feels like a bull market but carries very different risks. This guide breaks down exactly what causes a melt-up, how to spot one before the crowd does, and the practical steps you can take to protect your gains without sitting on the sidelines.
What Is a Melt-Up in the Stock Market?
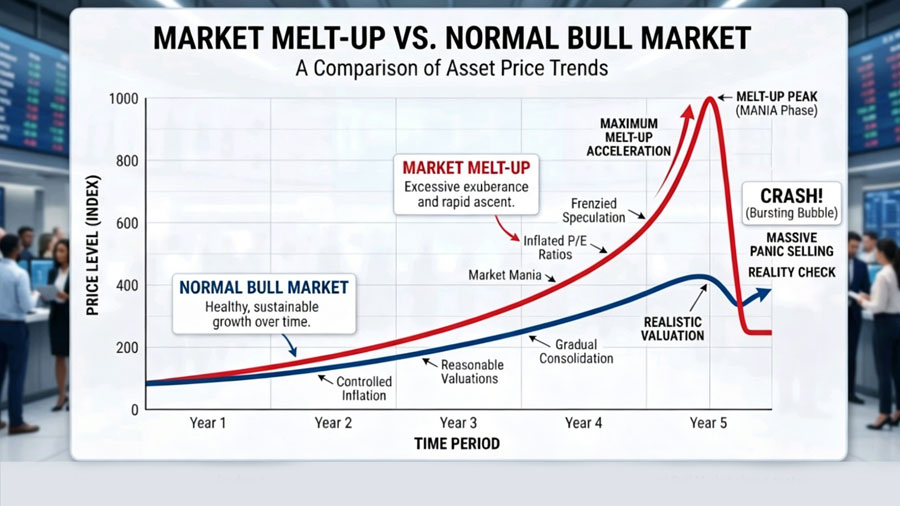
A melt-up is a sharp, sustained rise in asset prices driven primarily by investor psychology — not by improvements in corporate earnings, economic growth, or underlying fundamentals.
The name captures the dynamic well: prices don’t climb steadily. They melt upward — pulled by momentum, herd behavior, and the fear of missing out (FOMO), often accelerating the closer they get to a breaking point.
The gains are real. The problem is what drives them.
research on investor herding behavior and asset price momentum
Melt-Up vs. Normal Bull Market: What’s the Difference?
This is the question most financial articles skip. Here’s a direct comparison:
| Factor | Normal Bull Market | Melt-Up |
|---|---|---|
| Primary Driver | Earnings growth, GDP expansion | Investor sentiment, FOMO |
| Valuation Trend | Rises in line with fundamentals | Detaches sharply from earnings |
| Retail Participation | Moderate, gradual increase | Sudden spike in retail trading |
| Typical Duration | Years | Months (final leg of a cycle) |
| What Follows | Sustainable gains or soft correction | Higher probability of sharp reversal |
| Market Narrative | “Economy is strong” | “This time is different” |
The distinction matters because the right response to each is completely different.
Melt-Up vs. Meltdown: Two Sides of the Same Cycle
A meltdown is the reversal — a rapid, steep decline in asset prices, often triggered when the sentiment propping up a melt-up evaporates. History shows the two are frequently connected: the faster the melt-up, the harder the subsequent fall.
That said, not every melt-up ends in a meltdown. Some cycles decompress slowly. The risk isn’t certainty — it’s asymmetry.
What Causes a Stock Market Melt-Up?
The Psychology: FOMO at Scale
Melt-ups are fundamentally behavioral events. When investors see prices rising, two cognitive biases kick in hard:
- Recency bias: Recent strong returns feel like a reliable trend.
- Herding behavior: Watching others profit creates social pressure to join in.
Economist Robert Shiller calls this “narrative economics” — when a compelling story about markets spreads fast enough, it becomes self-fulfilling. People buy the story, prices rise, the story spreads further.
Macro Conditions That Set the Stage
Psychology alone doesn’t ignite a melt-up. These structural conditions typically fuel them:
- Low interest rates / central bank easing: When bonds yield almost nothing, capital floods into equities. Between 2020 and 2021, the Fed’s balance sheet expanded from $4.2 trillion to over $8.9 trillion — and the Nasdaq followed almost tick for tick.
- A credible technological narrative: Railroads in the 1880s, the internet in the 1990s, AI today. Transformative technology makes “the old rules don’t apply” feel rational.
- Retail investor surge: Platforms that lower the friction to invest bring in a new wave of buyers who are often less focused on valuation than on momentum.
Federal Reserve balance sheet historical data
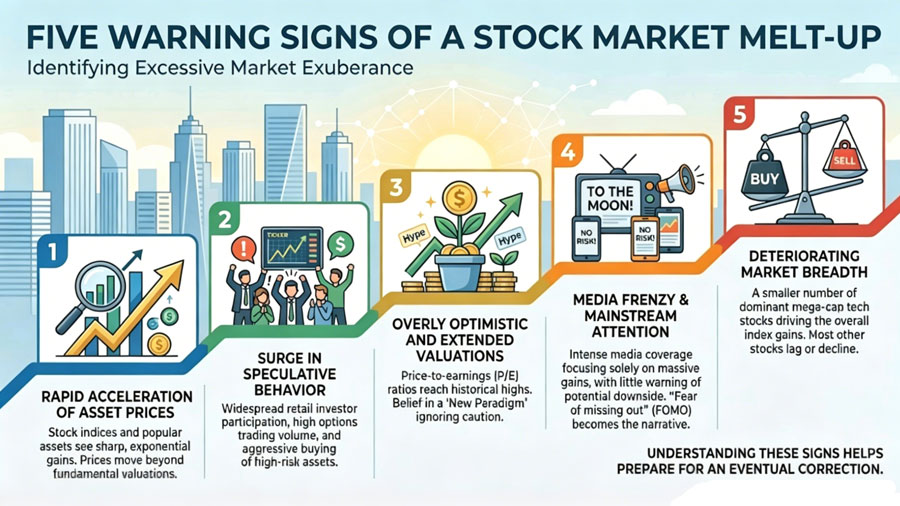
5 Warning Signs You’re in a Melt-Up
Note: These signals are an analytical framework, not a market timing tool. No indicator predicts tops with precision. See disclaimer below.
Signal 1: Valuations Detach from Earnings Reality
The Shiller CAPE ratio (cyclically adjusted price-to-earnings) is one of the most reliable long-term valuation gauges. Its historical average sits around 17. During the dot-com peak, it hit 44. When CAPE stretches significantly above its long-run average while earnings growth remains flat or decelerates, that’s a meaningful warning.
how to read the Shiller CAPE ratio and what it means for long-term returns
Signal 2: Retail Investor Participation Spikes Suddenly
During the 2021 meme-stock frenzy, retail traders accounted for roughly 25% of all U.S. equity trading volume — up from around 15% pre-pandemic. When new participants flood in driven by social media momentum rather than research, it’s a signal that sentiment, not fundamentals, is doing the heavy lifting.
Signal 3: Price Momentum Completely Overrides Fundamentals
Watch for stocks posting massive gains while their earnings guidance is flat or declining. When the market rewards story over numbers, you’re likely in melt-up territory.
Signal 4: Index Concentration Reaches Extreme Levels
As of 2024, the top 10 stocks in the Nasdaq 100 represented over 50% of the index. That level of concentration means index investors are making a massive, often unintentional, bet on a handful of companies. High concentration amplifies both gains and drawdowns.
Signal 5: “This Time Is Different” Becomes the Consensus
When mainstream financial media, retail investors, and even some institutional voices converge on the idea that conventional valuation frameworks no longer apply — that’s historically been one of the most reliable contrarian signals. Howard Marks has written extensively about how the most dangerous words in investing are exactly those four.
Historical Melt-Ups and What Happened Next
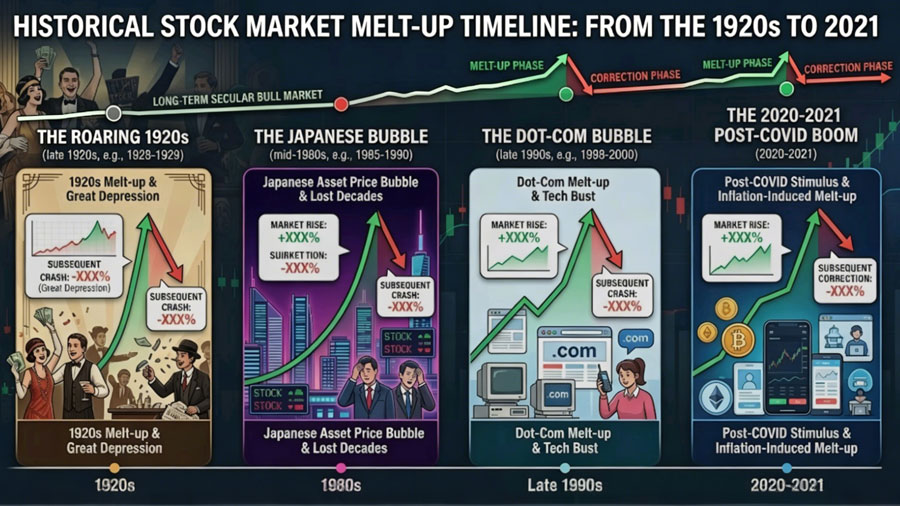
The Roaring Twenties (1921–1929)
The Dow Jones rose nearly 500% in eight years, fueled by post-war optimism, new consumer technologies, and easy credit. When credit tightened, the entire structure collapsed. The crash of 1929 wiped out roughly 90% of the Dow’s value by 1932.
Key lesson: Credit-fueled momentum is the most fragile kind.
Japan’s Nikkei Bubble (1980s)
Japan’s Nikkei 225 rose from around 6,000 in 1980 to nearly 39,000 by December 1989. At its peak, the land under the Imperial Palace in Tokyo was theoretically worth more than all of California. The index subsequently lost more than 80% of its value — and didn’t return to its 1989 high until 2024. That’s 35 years.
Key lesson: Melt-ups can permanently impair wealth if timed poorly.
The Dot-Com Bubble (1995–2000)
The Nasdaq 100 returned roughly 1,000% from 1990 to its March 2000 peak. Companies with no revenue traded at astronomical price-to-sales multiples. The crash that followed erased 83% of the index’s value. From 2000 to 2013 — a full 13 years — the Nasdaq’s total return was approximately 1%. Not per year. In total.
Key lesson: Genuine technological revolution doesn’t guarantee stock returns at any price.
The Post-COVID Tech Surge (2020–2021)
The Fed’s emergency rate cuts and asset purchases in March 2020 set off one of the fastest equity recoveries in history. The Nasdaq 100 gained over 100% from its March 2020 low to its November 2021 peak. Then it lost 33% through 2022 as the Fed reversed course.
This is the most instructive recent case: the technology was real, the companies were profitable — and the returns were still unsustainable at those valuations and that speed.
How to Invest During a Melt-Up: A Practical Framework
What NOT to Do
- Chase performance by concentrating further. Adding more to whatever is already up the most is exactly backwards risk management.
- Panic-sell everything. Exiting entirely creates its own risk — missing the final leg of a melt-up, plus the tax implications, can be costly.
- Use leverage. Borrowed money amplifies losses in a reversal. Melt-up environments are precisely when leverage becomes most dangerous.
A Balanced Approach That Actually Works
Systematic rebalancing is the most evidence-backed response to stretched valuations. If your target allocation is 70% equities and a melt-up has pushed you to 82%, rebalancing back to 70% forces you to take profits mechanically — without needing to predict the top.
Set a partial profit-taking rule in advance. For example: if any single position grows to more than 10% of your portfolio, trim it back to 7%. Rules remove emotion from the equation.
Diversify across asset classes, not just sectors. Holding tech plus more tech plus a growth ETF is not diversification. Real diversification means exposure to assets that behave differently under stress — international equities, short-duration bonds, and real assets.
A fee-only Certified Financial Planner (CFP) can help you build a rebalancing strategy specific to your tax situation and timeline. See disclaimer.
FAQ: Melt-Up Questions Answered
Q: How long does a melt-up typically last?
There’s no fixed timeline, but historically the “final surge” phase of major melt-ups has lasted between 6 and 24 months. The 2020–2021 tech melt-up ran about 18 months from the March 2020 lows to the late 2021 peak.
Q: What’s the difference between a melt-up and a bubble?
They often overlap but aren’t identical. A bubble refers to asset prices trading well above intrinsic value — it’s a valuation concept. A melt-up describes the process of rapid, sentiment-driven price acceleration. A melt-up can inflate a bubble, or it can occur within one.
Q: Can you profit from a melt-up without taking on too much risk?
Yes — by staying invested but systematically rebalancing as prices rise. Riding a melt-up with a pre-set exit rule is very different from chasing it with fresh capital at peak enthusiasm.
Q: Should I sell everything if I think we’re in a melt-up?
Timing the market consistently is not a strategy with a strong track record. A more practical approach is to reduce concentration, rebalance to your target allocation, and ensure you hold enough diversification to absorb a correction without being forced to sell at the bottom.
The Bottom Line
A melt-up isn’t a gift. It’s a test. The investors who come out ahead aren’t the ones who called the top — they’re the ones who built a portfolio that didn’t require them to.
Know the five signals. Understand the history. Rebalance when prices pull you off course. And resist the narrative that this time, the old rules don’t apply.
They always apply. Eventually.
⚠️ Disclaimer: This article is for informational and educational purposes only. Nothing in this content constitutes investment, financial, tax, or legal advice. Past market performance does not guarantee future results. All investing involves risk, including the potential loss of principal. Consult a licensed financial advisor or Certified Financial Planner (CFP) before making any investment decisions.